
Where Neural Networks Earn Their Keep in Demand Planning
When neural networks improve demand forecasts, how to train them on short weekly histories, and why every model should compete against simpler ones before it ships.
October 17, 2026Read More »
Neural networks aren't the only models that can follow a demand curve that bends. A set of boosted trees gets there by asking yes/no questions, one round of corrections at a time, and a support vector machine gets there by deciding which weeks to ignore. Here's how each one works, where each one wins, and why both still have to earn their place against everything else in the lineup.
In Where Neural Networks Earn Their Keep in Demand Planning, we looked at how a neural network learns a nonlinear relationship by bending a curve through weighted, activated layers, and we noted in passing that tree-based methods are a serious contender for the same job. This post picks up that thread, along with one more contender that rarely gets airtime: the support vector machine.
Both get to the same place a network does (a forecast that isn't a straight line) by completely different routes. A decision tree gets there by asking a sequence of yes/no questions. A support vector machine gets there by fitting a flat surface through a reshaped version of the regressor space it never has to visualize, and by refusing to chase routine noise along the way.
Both ideas are older than deep learning, both are cheap to train on a single product's history, and both hand a planner something a neural network doesn't: a structure you can point to. That's worth understanding on its own terms, not just as a fallback for combos where the network doesn't have enough history.
"Decision tree" undersells what's actually running. A single tree deep enough to capture real nonlinearity from a short history would carve roughly 150 weekly points into leaves holding only a few weeks each, and it would be badly overfit before it was useful for anything. So the model is a small set of gradient-boosted trees: several shallow trees built one after another, each fitted to whatever the trees before it got wrong.
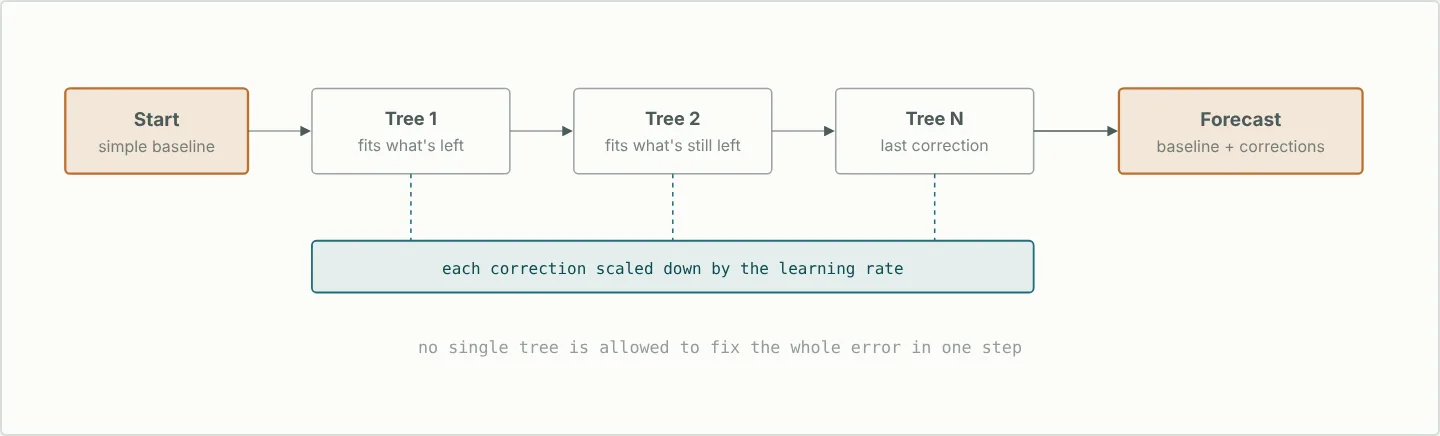
It starts from a simple baseline forecast. The first tree looks at the gap between that baseline and actual history (the residuals) and learns a correction. The next tree looks at what's still unexplained after that correction and learns a correction of its own, and so on for a set number of stages. The final forecast is the baseline plus the sum of every tree's correction.
Two things keep that loop from memorizing a short history. First, every tree is deliberately shallow, only a few levels deep, and no leaf may rest on fewer than a minimum number of weeks, so no single tree can carve out a rule for one odd week. Second, each correction is scaled down by a learning rate before it's applied, so no tree gets to fix the whole error in one step. The model has to find a pattern repeatedly, across stages, before it moves the forecast very far.
Inside each stage, a tree does what trees always do: it looks across every regressor in the combo's regressor library for the split that separates the remaining error most cleanly. Maybe Promo Volume < 240 separates weeks that still ran well below the forecast from weeks that ran well above it. The tree keeps the split that reduces error the most, then repeats the search on each side until it hits its depth or leaf-size limit.
In the neural network post, we argued that a model a planner can't interrogate is a model a planner can't safely override, and that every model should at least name the drivers it leaned on. A boosted tree model can go a step further. Its receipt isn't just a list of regressors; it's the rule itself, in the units a planner already thinks in:
A simplified illustration of the kind of rules the model log shows, not a literal system export.
That's a sentence a category planner can argue with. Not "the model thinks volume is high," but promotional volume above 240 units, and further, at a price under $11.25, adds about 34 units over the combo's baseline. When an override turns out to be wrong, this is what makes it possible to find out why. It's a property no amount of tuning gives a neural network's hidden layer.
Every one of those rules is written out with the forecast: the starting baseline, then each stage's splits, named by regressor, with the number of weeks behind each one and the adjustment it applied. One honest caveat: because the forecast is a sum of several stages, no single split tells the whole story. Reading the trail means following the baseline through each stage's adjustment, and the thresholds that keep recurring across stages are usually the ones that matter most.
A support vector machine gets to a nonlinear forecast in a way that has almost nothing in common with a tree. Rather than asking a sequence of questions, it fits one flat surface, but through a version of the regressor space that's been reshaped by a kernel, so a fit that's flat in that reshaped space comes back looking curved in the price, promotion, and trend values a planner actually sees. In effect, the kernel judges how similar two weeks are across every regressor at once, and lets similar weeks pull the forecast toward them without anyone having to write down what the curve should look like.
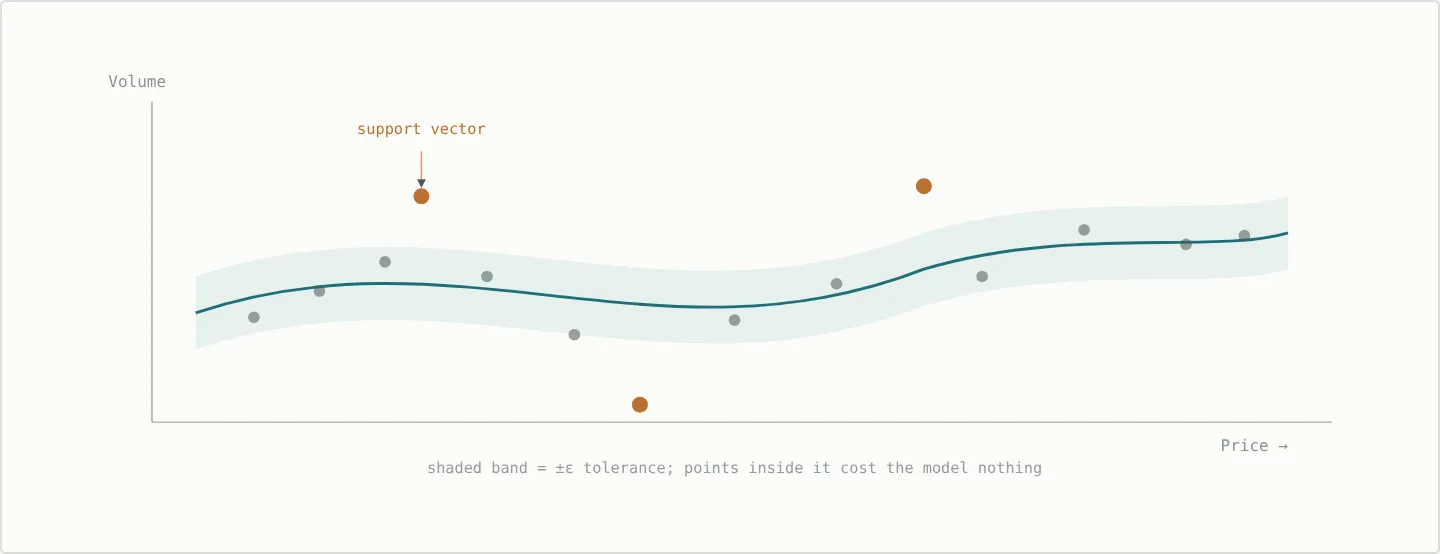
The more distinctive idea is what the model chooses to ignore. Ordinary regression tries to minimize error on every point, including the routine week-to-week noise no model should be chasing. An epsilon-insensitive SVM draws a tolerance band (a tube) around its fit and simply does not care about any point that falls inside it. Only the points on or outside the tube, the ones its width couldn't explain away as noise, get to influence where the fit sits. Those points are the model's support vectors, and in a real sense they're the only history the model bothered to learn from.
In plain terms: Most weeks look roughly like the weeks around them, and an SVM treats that ordinary wobble as free. It only pays attention to the weeks that genuinely surprised it, and it uses those to decide where the curve goes.
| Symbol | Role | Effect of raising it |
|---|---|---|
| C | Cost | Punishes points outside the tube harder, tightening the fit at the risk of chasing noise |
| γ | Kernel reach | Narrows how far a week's influence extends to similar weeks, letting the curve bend more sharply |
| ε | Tube width | Widens the band of error the model is willing to ignore outright |
Boosted trees tend to win when…: The real relationship is genuinely stepped (a promotional tier, a price break, a threshold past which behavior changes discretely rather than gradually), and when a legible split trail matters as much as the number itself.
SVMs tend to win when…: The relationship curves smoothly rather than stepping, the history is noisy enough that ignoring routine variation beats fitting it, and no one wants to guess the functional form in advance.
Neither answer is permanent. A combo that behaves like a step function during a promotional season can smooth out once the promotion calendar quiets down, and the competition re-scores every candidate often enough to notice.
Nothing here changes the rule from the neural network post: no model gets a permanent seat. The boosted tree model and the SVM sit in the same lineup as the neural network, the classical smoothers, and the intermittent-demand specialists, and all of them are held to the same standard: performance against held-out history, not the sophistication of the idea behind them. A product that favors boosted trees while promotions run in clean tiers can favor an SVM the next season once the pattern smooths out, or a plain moving average once the promotion calendar quiets down entirely. We cover how that competition and auto-weighting work more broadly in What “AI-Powered” Actually Means in Demand Planning.
The point was never to pick a favorite architecture. It's to let the data decide, and to keep checking.
Key takeaways
Curious which model is actually winning on your own combos, and why? Contact Areté

JR has 2 decades of experience in Demand and Supply Planning helping customers achieve desired results.
When neural networks improve demand forecasts, how to train them on short weekly histories, and why every model should compete against simpler ones before it ships.

A better forecast doesn't touch most of a planner's Monday morning. Agentic AI goes after the work that follows it: replenishment, exception triage, safety stock, promotion response, and supplier follow-up. What agents take on, what stays with the planner, and the questions to ask before you turn one on.

A single temperature excursion can make a whole truckload unsaleable, and cold chain failures often stay invisible until a return or an inspection. The five metrics that form a cold chain measurement program, the targets to hold them to, and the management practices behind them: carrier qualification, FEFO rotation, temperature mapping, and incident response.