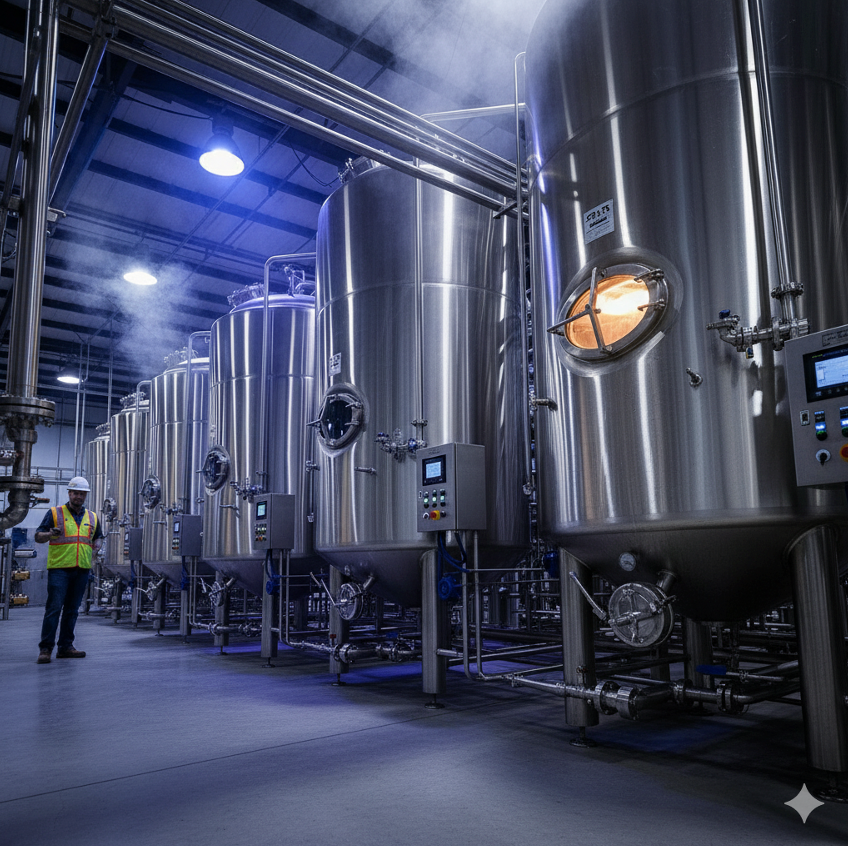
Areté recognizes that optimizing ingredient usage efficiency is fundamental for profitable beverage manufacturing. With the global sweetener market at US$90 billion+ in 2024, controlling this cost and maximizing yield of this ingredient is critical to reducing manufacturing cost. Whether you're managing sweetener utilization, concentrate yield, or CO₂ consumption, implementing the correct ingredient usage metrics drives both quality and profitability.
In this detailed guide, we'll explore seven essential usage metrics that carbonated beverage manufacturers must monitor, and will also discuss actionable strategies to implement best ingredient management practices.
Six Essential Material Usage Metrics
1. Sweetener Yield
Definition: Sweetener Yield measures the efficiency of sweetener utilization by comparing the theoretical quantity needed for net production against the actual amount consumed for a production batch.
Formula:

Key Components:
- Theoretical Quantity: Calculated amount of sweetener required for production based on recipe specifications and net production volume
- Actual Amount Consumed: Total weight of sugar or dry kilogram equivalent of high-intensity sweeteners (aspartame, sucralose, stevia, etc.) consumed for the production-related batch
Sample Performance Standards:
- Target Range:0% - 99.5%
- High Performance: ≥99.0%
- Requires Attention: <98.0%
Why It Matters: Sweetener represents one of the highest-cost ingredients in carbonated beverage manufacturing.. Poor yield indicates losses through spillage, inaccurate dosing, or process inefficiencies. With increasing consumer demand for low-sugar and zero-calorie options, optimizing artificial sweetener usage is crucial to cost management.
Action Plan:
- Monitor: Implement real-time batch tracking systems to capture precise sweetener consumption data
- Respond:
- Calibrate dosing equipment regularly to ensure accurate measurement
- Train operators on proper handling procedures for both dry and liquid sweetener systems
- Investigate process losses through systematic material balance audits
2. Concentrate Yield
Definition: Concentrate Yield measures the percentage of concentrate or beverage base contained in finished products compared to the quantity consumed in related batch production.
Formula:

Key Components:
- Theoretical Units: Net production volume divided by theoretical concentrate units per case
- Actual Units Consumed: Total concentrate volume procured for the production batch
Sample Performance Standards:
- Target Range:5% - 100.8%
- High Performance: ≥99.5%
- Requires Attention: <98.5%
Why It Matters: Concentrate is typically the most expensive ingredient per production unit in carbonated beverages. The difference between theoretical and actual yield represents concentrate loss, which directly impacts product cost and profit margins. Yields above 100% may indicate measurement errors or inventory discrepancies.
Action Plan:
- Monitor: Deploy automated concentrate dosing systems with flow meters and batch records
- Respond:
- Implement closed-loop concentrate handling to minimize exposure and evaporation losses
- Regular calibration of concentrate metering pumps and flow measurement devices
- Establish proper concentrate storage conditions to prevent degradation
3. Final Syrup Yield
Definition: Final Syrup Yield measures the efficiency of prepared syrup utilization in the finished product versus the quantity prepared during syrup blending operations.
Formula:

Key Components:
- Theoretical Liters: Calculated syrup volume required based on product specifications and net production cases
- Actual Liters Prepared: Total volume of finished syrup produced in blending tanks
Sample Performance Standards:
- Target Range:5% - 99.8%
- High Performance: ≥99.0%
- Requires Attention: <97.5%
Why It Matters: This metric identifies losses occurring during syrup preparation, transfer, and dispensing processes. Poor syrup yield can indicate equipment inefficiencies, line changeover waste, or cleaning losses that impact overall production economics.
Action Plan:
- Monitor: Install level sensors and flow meters on syrup preparation and distribution systems
- Respond:
- Optimize syrup tank cleaning procedures to minimize product losses
- Implement efficient line changeover protocols
- Use push-through techniques during product transitions
4. Carbon Dioxide Yield
Definition: CO₂ Yield measures the efficiency of carbon dioxide utilization by comparing the theoretical amount required for net production against actual CO₂ consumption.
Formula:

Calculation Components:
- Theoretical Weight: CO₂ volumes × container size (mL) × containers per case × 1.98 ÷ 1,000,000
- Actual Weight Consumed: Opening tank inventory - closing tank inventory + delivery receipts
Sample Performance Standards:
- Target Range: 85% - 95%
- High Performance: ≥90%
- Requires Attention: <85%
Why It Matters: CO₂ losses occur through system purging, pressure relief, and carbonation inefficiencies. With rising CO₂ costs and potential supply constraints, maximizing utilization is essential for cost control and sustainability.
Action Plan:
- Monitor: Install CO₂ flow meters and tank level monitoring systems
- Respond:
- Regular maintenance of carbonation systems and pressure relief valves
- Optimize filler counter-pressure settings to minimize CO₂ losses
- Implement CO₂ recovery systems where economically viable
5. Cleaning Chemical Efficiency Ratio
Definition: Cleaning Chemical Efficiency measures the consumption of cleaning agents used for equipment sanitation, expressed per unit of beverage produced.
Formula:

Key Components:
- Modern Alternatives: Besides traditional caustic soda (NaOH), consider enzymatic cleaners, acid cleaners, and sanitizers
- Measurement: Grams per liter or milliliters per hectoliter of finished product
Sample Performance Standards:
- Efficient Range:4 - 2.5 g/L for refillable bottle washing
- High Efficiency: ≤1.8 g/L
- Requires Optimization: >2.5 g/L
Why It Matters: Cleaning chemical costs and environmental impact are significant considerations in modern beverage manufacturing. Optimizing usage while maintaining sanitation standards improves sustainability and cost-effectiveness.
Action Plan:
- Monitor: Track chemical consumption through automated dosing systems
- Respond:
- Implement conductivity-based dosing control for caustic solutions
- Evaluate alternative cleaning chemistries for improved efficiency
- Optimize CIP (Clean-in-Place) cycle parameters
6. Water-to-Product Ratio (WPR)
Definition: Water-to-Product Ratio measures total water consumption relative to finished product output, including both ingredient water and process water usage.
Formula:

Key Components:
- Total Water: Ingredient water + cleaning water + cooling water + other process water
- Industry Benchmark:5:1 to 3.0:1 depending on facility efficiency and water recovery systems
Sample Performance Standards:
- World-Class: ≤2.0:1
- Good Performance:0:1 - 2.5:1
- Requires Improvement: >3.0:1
Why It Matters: Water is a primary ingredient in carbonated beverages, so process water consumption significantly impacts operating costs and environmental sustainability. Efficient water management is increasingly important for regulatory compliance and corporate sustainability goals.
Action Plan:
- Monitor: Install water meters throughout the facility to track consumption by area
- Respond:
- Implement water recovery and reuse systems
- Optimize cleaning cycle water usage
- Regular audit of water losses and leakage
7. Overall Ingredient Efficiency (OIE)
Definition: Overall Ingredient Efficiency is a comprehensive measure of total ingredient utilization across all major components in the production process.
Formula:
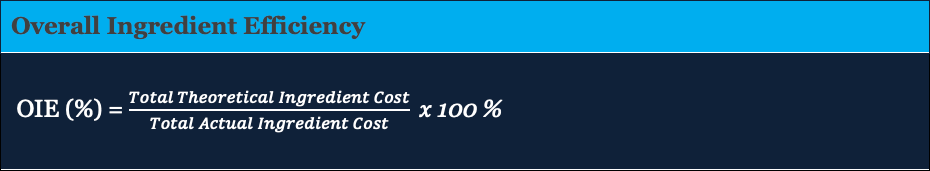
Key Components:
- Weighted average of all ingredient yields based on cost contribution
- Includes sweeteners, concentrates, CO₂, water, and packaging materials
Sample Performance Standards:
- Target Range: 96% - 99%
- Excellence: ≥98%
- Action Required: <96%
Why It Matters: This holistic metric provides management with a single KPI to assess overall ingredient management effectiveness and prioritize improvement initiatives based on cost impact.
Action Plan:
- Monitor: Integrate all ingredient tracking systems into a unified dashboard
- Respond:
- Prioritize improvement efforts based on cost impact analysis
- Implement cross-functional teams to address systemic inefficiencies
- Benchmark performance against industry standards and best practices
Implementation of Efficiency Best Practices
Technology Integration:
- Deploy Manufacturing Execution Systems (MES) for real-time ingredient tracking
- Implement automated data collection to reduce manual errors
- Use predictive analytics to identify trends and prevent losses
Organizational Excellence:
- Establish clear accountability for ingredient efficiency metrics
- Provide regular training on proper handling and measurement procedures
- Create incentive programs tied to efficiency improvements
Continuous Improvement:
- Conduct monthly ingredient efficiency reviews
- Benchmark performance against industry leaders
- Implement lean manufacturing principles to eliminate waste
Conclusion
Effective ingredient management in carbonated beverage manufacturing requires systematic monitoring of key metrics. By implementing robust measurement systems and taking proactive action to optimize efficiency, manufacturers can achieve significant cost savings, improve product quality, and enhance sustainability outcomes.
Recent industry case studies demonstrate that strategic process control and continuous improvement can cut waste in half and increase efficiency by up to 5 percentage points, directly translating to improved profitability.
The carbonated beverage industry continues to evolve for changing consumer preferences and regulatory requirements. Companies that excel at ingredient efficiency management will be best positioned to adapt while maintaining competitive cost structures and operational excellence.
Manufacturers should begin by establishing baseline measurements for efficiency metrics and then systematically implement improvement initiatives based on a facility's specific opportunities. An investment in ingredient efficiency monitoring and optimization will pay on-going dividends through reduced costs, improved quality, and enhanced operational performance.