Efficient material utilization is critical for sustainable and profitable beverage manufacturing. With the sustainable packaging market valued at approximately USD 292.71 billion in 2024 and growing consumer demand for environmentally responsible packaging, optimizing material usage has never been more important. Whether you're managing primary package efficiency, closure system yields, or secondary packaging optimization, implementing comprehensive material usage metrics drives both operational excellence and sustainability goals.
In this detailed blog, we'll explore six key material usage metrics that beverage manufacturers must monitor, along with actionable strategies to implement best-in-class material management practices in today's circular economy landscape.
Six Key Material Usage Metrics
1. Non-Refillable (N/R) Primary Package Yield
Definition: N/R Primary Package Yield measures the efficiency of primary packaging utilization by comparing the theoretical quantity of containers required for net production against the actual amount purchased and consumed during production runs.
Formula:

Lorem ipsum dolor sit amet, consectetur adipiscing elit. Ut elit tellus, luctus nec ullamcorper mattis, pulvinar dapibus leo.a
Key Components:
- Theoretical Packages: Calculated number of containers (bottles, cans, pouches) required based on production specifications and net case output
- Actual Packages Consumed: Total primary containers consumed during the production batch, calculated through inventory movement tracking of empty packages
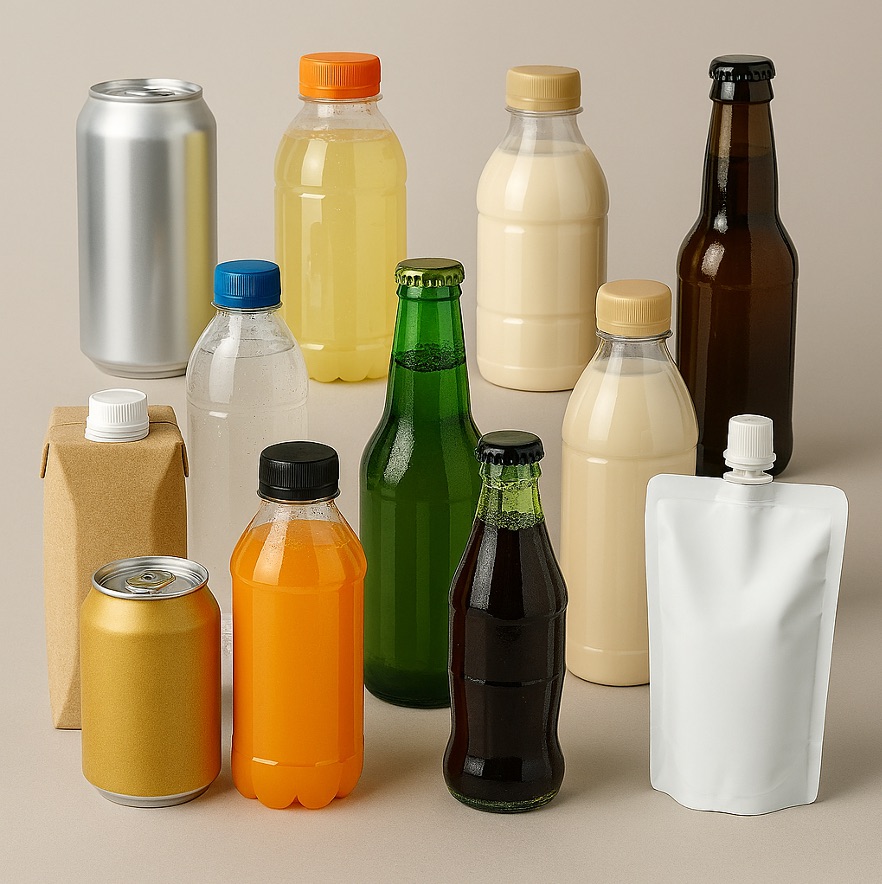
- Modern Container Types: PET bottles, aluminum cans, glass bottles, flexible pouches, and hybrid packaging solutions
Sample Performance Standards:
- Target Range:5% - 99.8%
- Excellence: ≥99.5%
- Requires Investigation: <98.0%
Why It Matters: Primary packaging represents 15-25% of total beverage production costs. Poor yields indicate losses through handling damage, line jams, quality rejects, or inventory management issues. With increasing reliance on recycled plastics such as PET, HDPE, and PP, optimizing container utilization supports both cost management and circular economy objectives.
Action Plan:
- Monitor: Deploy real-time package tracking systems with barcode scanning and automated counting
- Respond:
- Implement gentle handling procedures for lightweight sustainable containers
- Optimize line changeover protocols to minimize package waste
- Regular calibration of filling and capping equipment to reduce rejects
- Establish supplier quality agreements to minimize incoming defects
2. Closure System Yield
Definition: Closure System Yield measures the efficiency of closure utilization by comparing the theoretical quantity of caps, crowns, or sealing systems required for finished products against the actual quantity consumed during production.
Formula:

Key Components:
- Theoretical Closures: Net production cases multiplied by closures per case based on product specifications
- Actual Closures Consumed: Total closure inventory movement, calculated from stock counts with partial quantities weighed and converted to closure equivalents
- Modern Closure Types: Twist-off caps, sports caps, pump dispensers, easy-open ends, and tamper-evident systems
Sample Performance Standards:
- Target Range:0% - 99.8%
- High Performance: ≥99.5%
- Requires Attention: <99.0%
Why It Matters: Closures are critical for product integrity and consumer experience. Modern closures often incorporate advanced features like freshness indicators, portion control, and enhanced recyclability. Efficient utilization ensures cost control while maintaining quality standards.
Action Plan:
- Monitor: Implement automated closure counting systems with weight verification for partial containers
- Respond:
- Regular maintenance of capping equipment to prevent damage and double-feeds
- Optimize torque specifications to minimize over-tightening damage
- Implement quality control protocols for incoming closure materials
- Train operators on proper closure handling procedures
3. Label Yield Efficiency
Definition: Label Yield measures the efficiency of labeling materials by comparing the theoretical quantity of labels required for finished products against the actual labels consumed during production.
Formula:

Key Components:
- Theoretical Labels: Net production volume multiplied by labels per container (including primary, secondary, and promotional labels)
- Actual Labels Consumed: Total label inventory movement from stock counts, with partial rolls weighed for accurate conversion
- Modern Label Types: Pressure-sensitive labels, shrink sleeves, in-mold labels, digital printed labels, and smart labels with QR codes
Sample Performance Standards:
- Target Range:0% - 99.8%
- Excellence: ≥99.5%
- Action Required: <98.5%
Why It Matters: Labels are essential for brand communication, regulatory compliance, and consumer engagement. Modern labels often incorporate sustainability features, digital connectivity, and enhanced graphics that require careful handling to maintain quality and minimize waste.
Action Plan:
- Monitor: Deploy label counting systems with automatic waste tracking and roll weight verification
- Respond:
- Optimize labeling equipment settings to minimize material waste during startup and changeovers
- Implement proper storage conditions to prevent label adhesive degradation
- Regular cleaning and maintenance of label applicators
- Establish label roll management protocols to minimize end-of-roll waste
4. Secondary Packaging Yield
Definition: Secondary Packaging Yield measures the efficiency of secondary packaging materials (cartons, trays, multipacks) by comparing theoretical requirements against actual consumption during production runs.
Formula:

Key Components:
- Theoretical Packages: Net production cases divided by pack configurations (4-packs, 6-packs, 12-packs, 24-packs, etc.)
- Actual Packages Consumed: Total secondary packaging inventory movement calculated from supplier-declared contents per pallet or case
- Modern Secondary Packaging: Recyclable cartons, biodegradable wrapping, reusable containers, and minimal packaging designs
Sample Performance Standards:
- Target Range:5% - 99.9%
- High Efficiency: ≥99.7%
- Needs Improvement: <99.0%
Why It Matters: Secondary packaging protects products during distribution and serves as a key consumer touchpoint. With over 40% of companies adopting innovative and sustainable packaging techniques by 2025, optimizing secondary packaging supports both cost management and environmental goals. Modern Extended Producer Responsibility (EPR) regulations also require manufacturers to consider end-of-life packaging management.
Action Plan:
- Monitor: Implement automated secondary packaging counting with integration to case packing equipment
- Respond:
- Optimize case packing equipment to minimize handling damage
- Implement lean changeover procedures to reduce setup waste
- Establish supplier partnerships for just-in-time delivery to minimize storage damage
- Regular equipment calibration to ensure proper case forming and sealing
5. Material Circularity Index (MCI)
Definition: Material Circularity Index measures how effectively packaging materials are designed for and participate in circular economy principles, including recyclability, recycled content usage, and end-of-life recovery.
Formula:

Key Components:
- Recycled Content: Post-consumer recycled (PCR) materials incorporated into packaging
- Recyclable Materials: Packaging components that can be effectively processed through existing recycling infrastructure
- Recovery Rate Weighting: Actual local recycling rates for different material types
Sample Performance Standards:
- Target Range: 75% - 95%
- Sustainability Leader: ≥85%
- Improvement Needed: <60%
Why It Matters: A circular packaging economy aims to minimize waste and maximize the value of resources by keeping materials in use for as long as possible. This metric helps manufacturers align with sustainability goals and regulatory requirements while meeting consumer expectations for environmentally responsible packaging.
Action Plan:
- Monitor: Track material specifications and supplier certifications for recycled content and recyclability
- Respond:
- Partner with suppliers to increase recycled content without compromising quality
- Design packaging for improved recyclability and material separation
- Implement take-back programs where feasible
- Collaborate with recycling infrastructure development initiatives
6. Packaging Material Loss Ratio
Definition: Packaging Material Loss Ratio measures packaging material losses throughout the warehousing, production, and distribution processes as a percentage of total material purchased.
Formula:

Packaging Material Loss Ratio
Packaging Material Loss Ratio (%) = (Total Material Losses / Total Material Purchased) × 100%
Key Components:
- Total Material Losses: Damaged materials, production waste, handling losses, and obsolete inventory
- Total Material Purchased: All packaging materials procured during the measurement period
- Loss Categories: Handling damage, quality rejects, changeover waste, and storage deterioration
Sample Performance Standards:
- Target Range:5% - 2.0%
- Excellence: ≤1.0%
- Requires Action: >3.0%
Why It Matters: Material losses directly impact profitability and sustainability metrics. Minimizing losses reduces costs, environmental impact, and waste disposal requirements while improving overall operational efficiency.
Action Plan:
- Monitor: Implement comprehensive material tracking from receipt through production completion
- Respond:
- Optimize material handling procedures and equipment
- Implement predictive maintenance to prevent equipment-related damage
- Establish proper storage conditions to prevent material degradation
- Regular training on material handling best practices
Implementation of Material Excellence Best Practices
Technology Integration:
- Deploy IoT sensors and smart packaging technologies for real-time material tracking
- Implement digital twin systems to optimize packaging line performance
- Use predictive analytics to forecast material needs and prevent shortages
- Integrate packaging equipment with Manufacturing Execution Systems (MES) for automated data collection
Sustainability Focus:
- Paper packaging dominates the sustainable packaging market, commanding approximately 46% market share in 2024
- Evaluate alternative materials including bio-based plastics, plant-based films, and compostable options
- Implement life cycle assessments to measure environmental impact across material choices
- Establish supplier scorecards incorporating sustainability metrics
Organizational Excellence:
- Create cross-functional material optimization teams including procurement, operations, and sustainability
- Establish clear accountability for material efficiency metrics at all organizational levels
- Implement incentive programs tied to both efficiency and sustainability improvements
- Provide comprehensive training on sustainable packaging principles and handling procedures
Continuous Improvement:
- Conduct monthly material efficiency reviews with root cause analysis for deviations
- Benchmark performance against industry leaders and sustainability standards
- Implement lean manufacturing principles focused on packaging waste elimination
- Establish innovation partnerships with packaging suppliers and technology providers
Industry Trends and Future Considerations
Regulatory Landscape:
- Extended Producer Responsibility (EPR) regulations requiring packaging waste management
- Plastic waste reduction targets and single-use packaging restrictions
- Mandatory recycled content requirements for various jurisdictions
- Carbon footprint disclosure requirements on packaging materials
Consumer Expectations:
- Increased demand for minimal, sustainable packaging solutions
- Growing preference for reusable and refillable packaging options
- Expectation for clear recyclability guidance and sustainability claims
- Digital engagement through smart packaging technologies
Technology Advancement:
- AI-powered packaging optimization and predictive maintenance
- Blockchain technology for supply chain transparency and circularity tracking
- Advanced material science enabling new sustainable packaging options
- Automation and robotics that improve material handling efficiency
Conclusion
Effective material management in beverage manufacturing requires systematic monitoring of key comprehensive metrics that balance operational efficiency with sustainability objectives. Through implementing robust measurement systems and taking proactive action to optimize material utilization, manufacturers can achieve significant cost savings, improve environmental performance, and enhance brand reputation.
Recent industry analysis demonstrates that companies implementing comprehensive material efficiency programs can reduce packaging costs by 8-15% while improving sustainability metrics by up to 30%. Such improvements translate directly to enhanced profitability and competitive advantage in an increasingly environmentally conscious marketplace.
The beverage industry continues to evolve rapidly in response to changing consumer preferences, regulatory requirements, and sustainability imperatives. Companies that prioritize material efficiency management while embracing circular economy principles will be best positioned to thrive in this dynamic environment while maintaining operational excellence.
Manufacturers should begin by establishing baseline measurements for all material efficiency metrics and then systematically implement improvement initiatives based on their facility's specific opportunities and sustainability goals. Investment in material efficiency monitoring and optimization will deliver ongoing benefits through reduced costs, improved environmental performance, and enhanced operational resilience.
Success in material optimization requires a holistic approach that considers the entire packaging lifecycle, from design and sourcing through end-of-life recovery. By embracing both operational excellence and sustainability leadership, beverage manufacturers can create lasting competitive advantages while contributing to a more sustainable future.