Seamlessly integrate with Tableau & Power BI using new XTable Exports!
Newsletter: April 2025
Easily push data from Prevail11 into Tableau & Power BI using New Meta Report Options
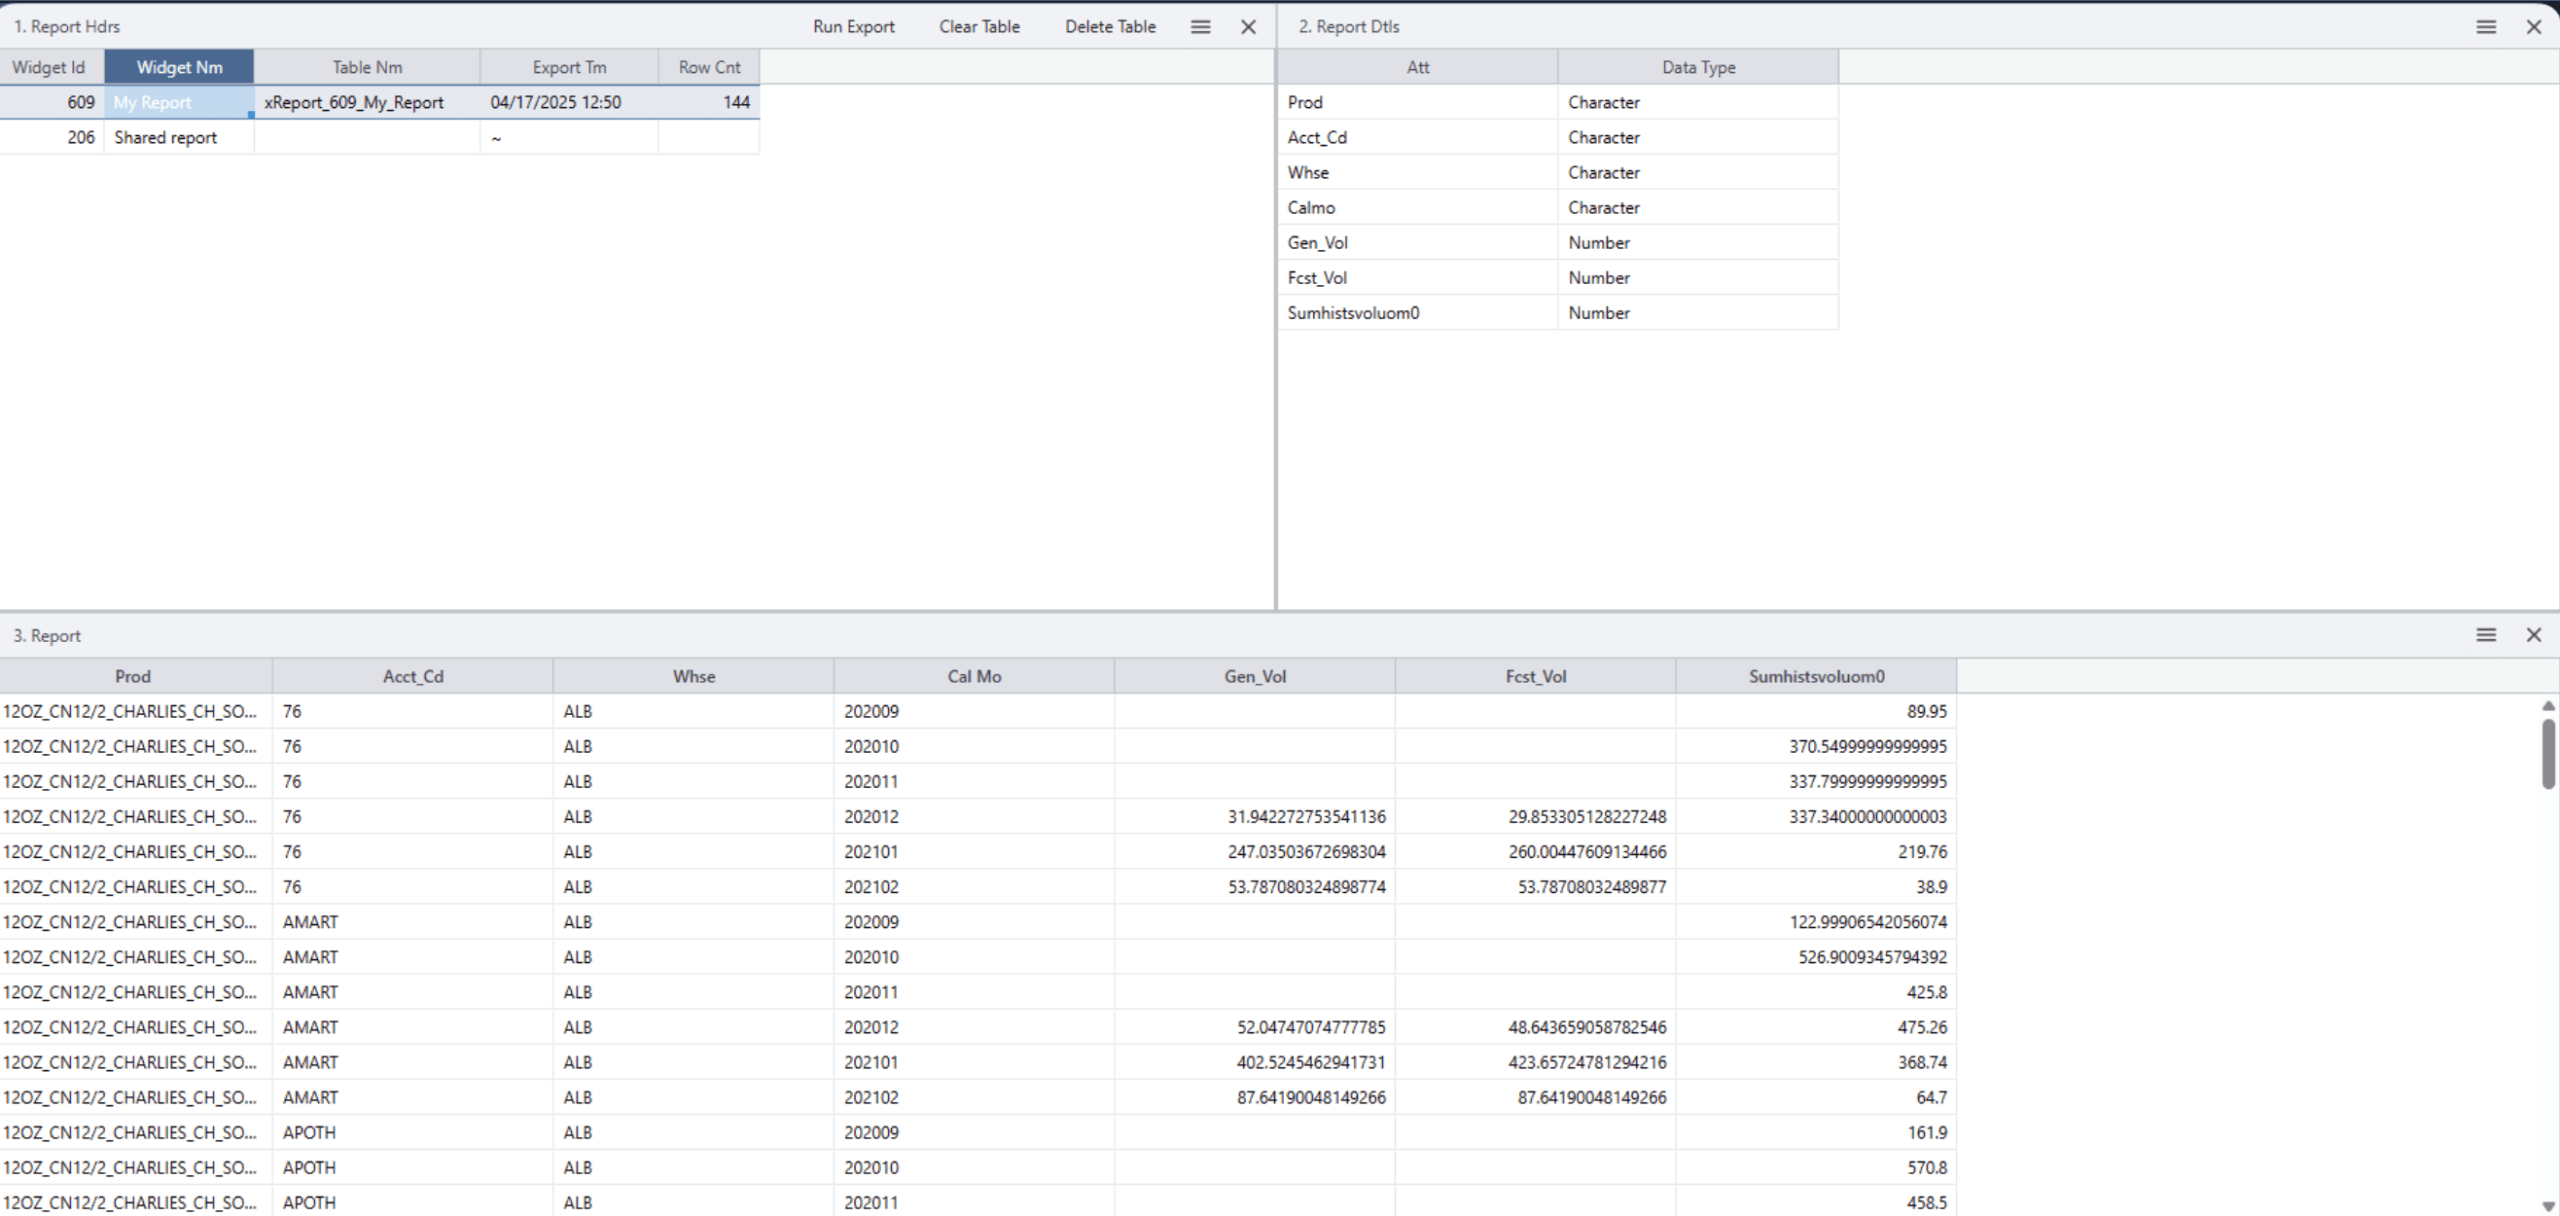
Planners can now select a saved or a shared Meta Report to be exported as an "XTable", which is a new type of reporting interface. Prevail11's smart naming function assigns a unique Widget-ID to each Meta Report for ease of location, accessibility and storage.
In the Manage Exported Reports option, Planners see each Meta Report and its associated XTable along with the most recent Export Time and Row Count of the report. The Report Dtls Pane of the Manager displays all XTable column names, and the Report Pane displays the actual XTable records. Planners now also have the option to re-run an export to refresh data, delete all XTable data or drop the XTable completely.
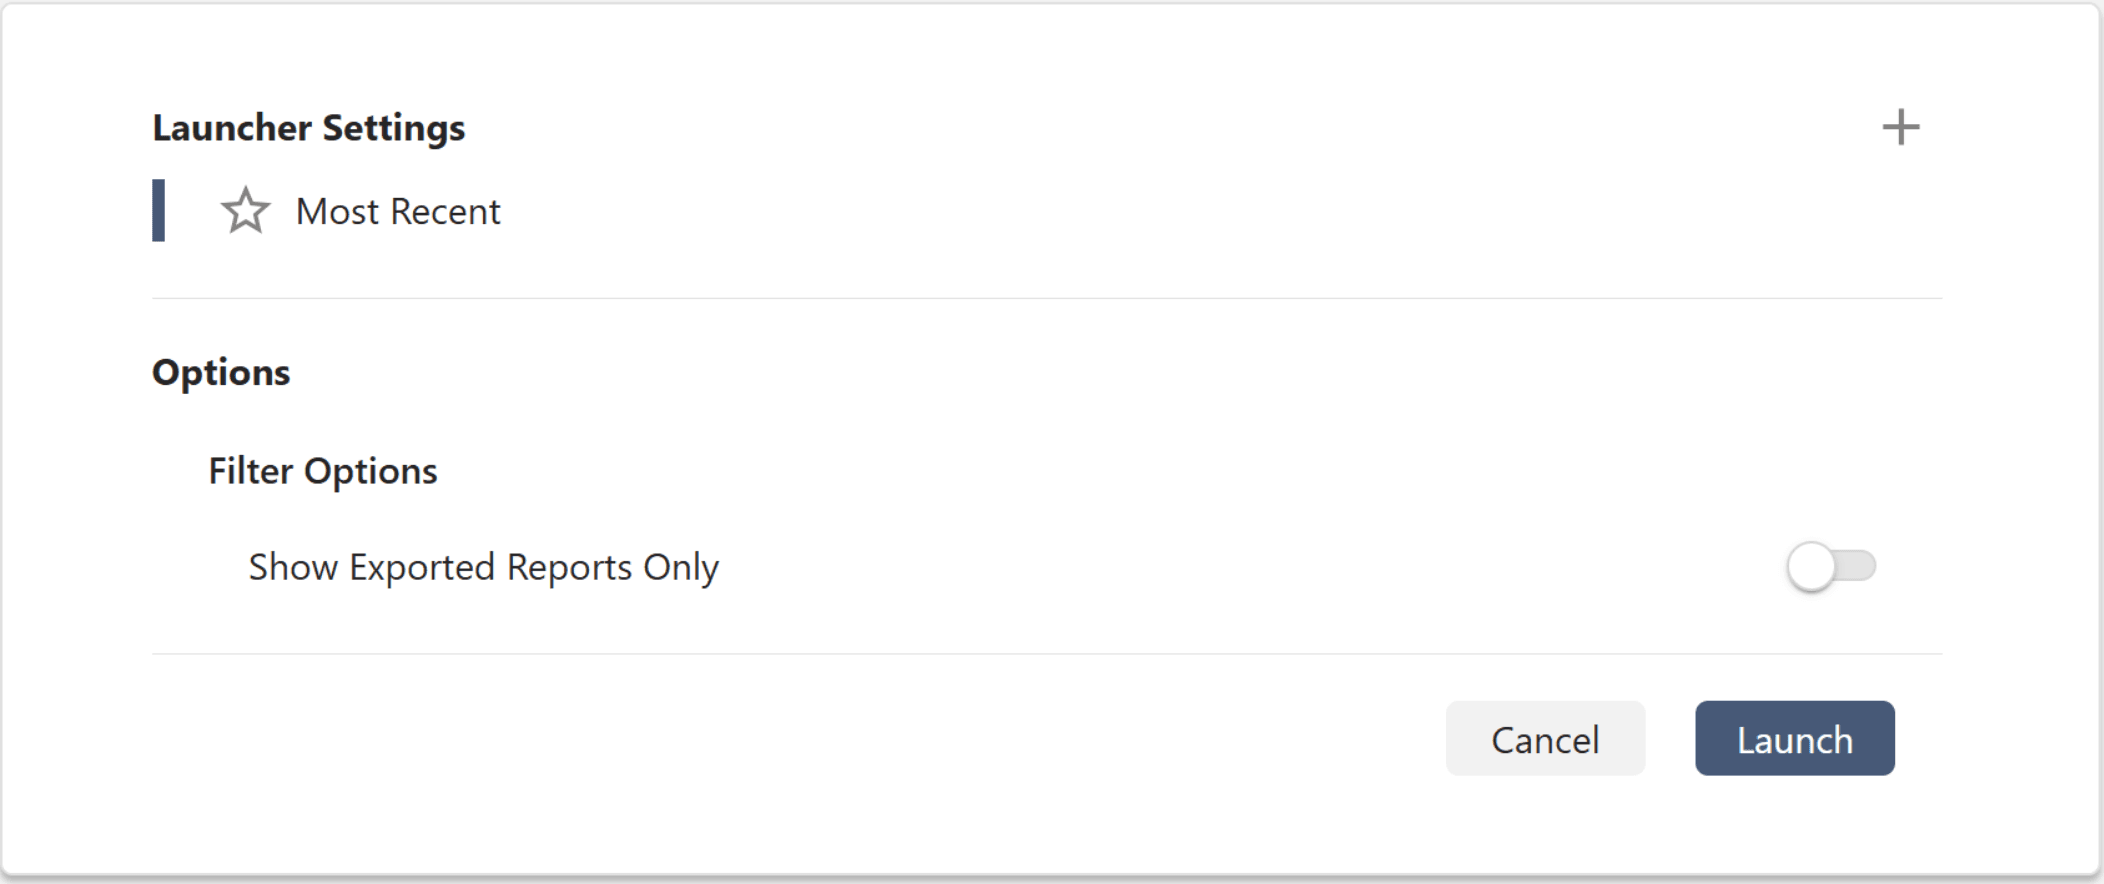
The Manage Exported Reports launcher form now has the option to "Show Exported Reports Only", to only display reports that have been exported to an existing XTable.
Create Detailed Meta Reports for Specific Time Frames
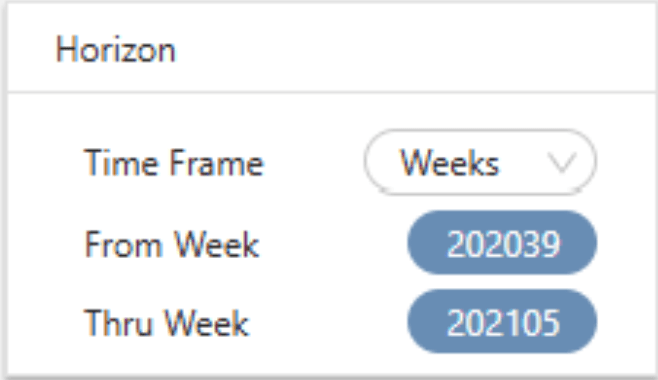
Prior to the latest release, Prevail11 had an option to filter Meta Reports by Calendar Week only. Areté improved the Meta Report to filter reports based on any available configurable time frame, such as Weeks, Months or Periods. This has been enhanced to provide a better user experience and more flexible and configurable reporting.
Now consolidate PTD and PTG in your Excel Outline Exports
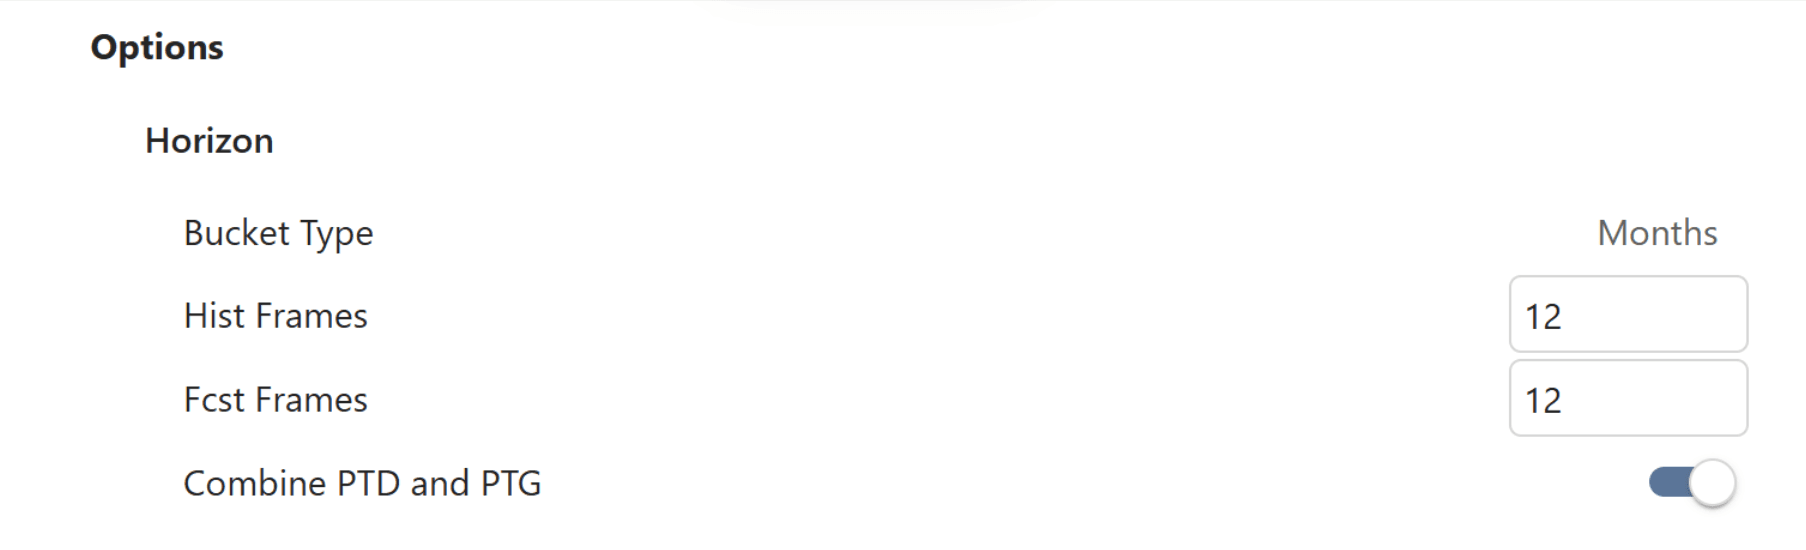
The Export Excel Outline function now features an option to combine the PTD (Period-to-Date) and PTG (Period-to-Go) values for the current month, when exporting by month. Simply select the Combine PTD and PTG option on the launch form for more tailored monthly Excel Outlines.
Contact us to learn more about all updates and enhancements in the latest version.
Contact Us →Check out our Blog to explore Supply Chain Strategies for Success!

Optimizing Sales and Delivery Performance with Key Metrics
The second part of our distribution series focuses on sales performance, fleet capacity, and customer satisfaction. We discuss key metrics for efficient distribution operations like Sales per Route, Fleet Capacity Utilization, and On-time delivery rate.
Read more here →
Key Distribution Metrics for Fleet and Labor Efficiency
Our first blog of a two-part series that delves into three Key Distribution Measures to optimize fleet and labor efficiency and provides actionable steps towards improvement in these areas.
Read more here →Check out more Blog Posts for Supply Chain Excellence Strategies
Blog →Contact us if you have any questions or suggestions!
Areté values honest customer feedback. Please take this three-question, anonymous Survey to let us know how we are doing.
Customer Survey →About the Author

Shruti Natal
Business Development and Supply Chain Optimization Analyst
Shruti is a part of the implementation team (Prevail and Avail). She collaborates with clients to ensure a smooth working experience with Areté Inc.