In today's competitive manufacturing landscape, understanding and optimizing production efficiency is crucial for sustainable operations. This comprehensive blog post explores key production measures that help manufacturers identify opportunities for improvement and optimize their operations for the value chain.
Core Efficiency Metrics
Line Efficiency and Utilization
The foundation of production metrics consists of two fundamental measures:
- Line Efficiency = Actual Output / Potential Output
- Line Utilization = Actual Time in Use / Total Available Time
These fundamental metrics provide a snapshot of how effectively production resources are used but to truly understand production performance, we need to dive into more sophisticated measurements.
Overall Equipment Effectiveness (OEE)
OEE is the gold standard for measuring manufacturing productivity. It's composed of three critical components: Availability, Performance, and Quality.
1. Availability
Availability is the measure of how much total planned production time is actually used to produce:
Availability = Run Time / Planned Production Time
where Run Time = Planned Production Time − Stop Time
This metric reflects how much available time is lost to both planned and unplanned stoppages.
2. Performance
Performance captures how efficiently the production line runs when it is operating. It accounts for all factors that cause a production asset to operate below its maximum possible speed, including:
- Small stops
- Sub-optimal operating speeds
Performance = (Ideal Cycle Time × Total Count) / Run Time
3. Quality
Quality measures how many “good” units are produced against the total units started in production:
Quality = Good Count / Total Count
This metric is crucial, as it directly impacts customer satisfaction and bottom-line profitability.
By combining the three components as follows, we have our first key measure:
OEE = Availability x Performance x Quality
Advanced Production Metrics
Planned Downtime Ratio
While traditional OEE accounts for planned stops and focuses on unplanned stops, tracking planned production stoppages is equally important:
Planned Downtime Ratio = (Total Planned Stoppage Time / Planned Production Time) × 100%
This downtime metric includes:
- Changeovers
- Scheduled maintenance
- Team meetings
- Scheduled breaks
Maintenance Cost Ratio
To ensure sustainable operations, the MCR metric tracks maintenance costs relative to asset value:
Maintenance Cost Ratio = (Total Maintenance Cost / Replacement Asset Value) × 100%
Performance Against Schedule
This standard performance metric tracks production planning accuracy:
Performance Against Schedule = |Scheduled quantity - Net Cases produced| / Net Cases produced × 100
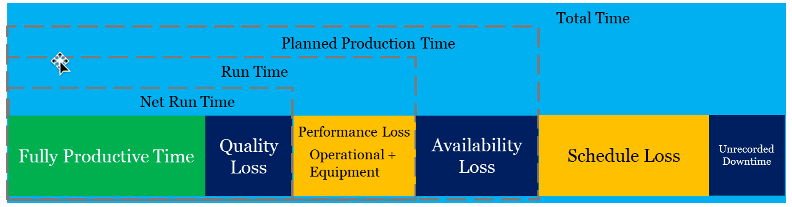
Production Time Hierarchy
Understanding how different types of production time are related is crucial to successful measurements:
Total Time, which is time available in the planning horizon covering both production and non-production periods, breaks down into:
- Planned Production Time
- Schedule Loss: Time not expected to be running production.
- Unrecorded Downtime: When existing reporting doesn’t consider micro stops, this allows everything to add up to the Total Time available.
Planned Production Time further breaks down into:
- Run Time
- Availability Loss: Events that stop planned production for a significant amount of time such as equipment failures or changeovers.
Run Time breaks down into:
- Net Run Time
- Performance Loss: factors that cause production to operate at less than maximum possible speed. This could be further categorized into Equipment Performance Loss (e.g. wear and tear on machinery slowing it down) and Operational Performance Loss (e.g. inadequate training of employees running machines). This can also be considered Idle Time.
Net Run Time breaks down into:
- Fully Productive Time
- Quality Loss: Time due to making defective units
See Production Time Hierarchy visual below:
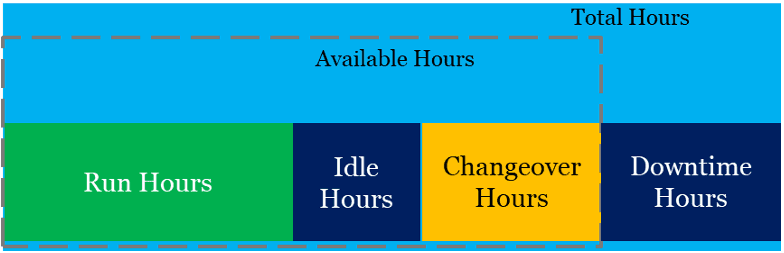
Alternative Method
It can be difficult to fully and confidently track each of the components used to calculate OEE. An alternative straightforward method for tracking that production resources are optimized, downtime is minimized and output is maximized may be implemented through the following measures:
- Total Hours: The total time available within the planning horizon, covering both production and non-production periods.
- Available Hours: The portion of total hours that can be allocated to production, excluding planned downtime like maintenance.
- Downtime Hours: Any period when production stops due to equipment failures, maintenance, or other disruptions.
- Idle Hours: Available production time that remains unused due to inefficiencies, scheduling gaps, or resource constraints.
- Changeover Hours: The time required to switch between production runs, including setup, cleaning, and reconfiguration.
- Run Hours: The actual hours scheduled for production, excluding idle time and changeovers.
Key Performance Indicators (KPIs) used for this method:
Time Utilization (%) – Measures the percentage of total hours effectively used for production:
Time Utilization=Run Hrs / Total Hrs ×100
Line Utilization (%) – Evaluates how efficiently available production hours are utilized:
Line Utilization=Run Hrs / Available Hrs ×100
See Alternative Time Hierarchy visual below:
Areté’s Production Scheduling functionality tracks critical production metrics used in the Alternative Method to drive smarter decision making.
Real-World Considerations
Warm-Up Effects
Production lines often can't achieve peak efficiency soon after startup. Several factors influence this "warm-up" period:
- Equipment Temperature Stabilization
- Mechanical systems need time to reach optimal operating temperatures
- Lubricants need to distribute properly as required
- Process Stabilization
- Product quality parameters need to stabilize
- Operating crews need to synchronize their activities
- Initial Quality Adjustments
- First pieces often require additional quality checks
- Parameters may need fine-tuning based on initial production results
Areté’s methodology for determining the amount of time for a production run of a required quantity includes several parameters that capture line warm-up time.
Achieving Perfect Production
Perfect Production (100% OEE) and perfect Time and Line utilization requires:
- 100% Quality: Only good parts were produced
- 100% Performance: Operating at maximum possible speed
- 100% Availability: No stop time
- 100% reporting accuracy and availability
While 100% OEE might seem theoretical at best, understanding the required metrics helps to identify improvement opportunities and set realistic targets for continuous improvement.
Summary
Measuring production performance is essential for identifying improvement opportunities and tracking progress. While OEE provides a comprehensive view of production efficiency, supporting metrics like planned downtime and maintenance costs offer additional insights for optimizing operations. By understanding and monitoring these metrics, manufacturers can make data-driven decisions to improve their operations continuously.
Remember: the goal isn't perfect scores across all metrics, but rather continuous improvement and balanced optimization of key interconnected measures.