Accurate demand planning is the cornerstone of efficient inventory management because it supports determining optimal stock levels, minimizing carrying costs while maximizing service levels. Two key metrics that are often used to calculate forecast accuracy are Mean Absolute Percentage Error (MAPE) and Weighted Absolute Percentage Error (WAPE). While both have their place, WAPE is often the superior choice for demand planning because it weights errors based on sales volume which aligns forecast accuracy with real-world inventory impact.
Problems when using MAPE for Demand Planning Accuracy
MAPE calculates the average percentage error across all products while weighting each SKU equally, regardless of demand volume. Equal SKU weighting creates several issues for demand planners:
Overemphasizes Low-Volume Items – For MAPE, 50% error on a slow-moving product (e.g., 2 units/month) is weighted equally to 50% error on a high-demand item (e.g., 1,000 units/month). In reality, the inventory consequences of these errors are vastly different.
Underestimates High-Volume Errors – MAPE also does not sufficiently penalize forecast mistakes for top-selling products, thereby understating risks of costly stockouts or overstocking.
Leads to Poor Inventory Allocation – Because safety stock and reorder points typically depend upon demand variability, equal weighting of forecast error can distort volume-sensitive inventory policies which often leads to holding too much low-value SKU stock and too little high-impact SKU stock.
Why WAPE is the Better Metric for Demand Planning
WAPE, also known as MAD/Mean Ratio or Weighted MAPE, measures total absolute error as a percentage of total demand, making it volume-sensitive which provides a critical advantage as a demand planning metric.
Benefits of WAPE for Demand Planning:
✔ Reflects True Business Impact – WAPE is much more sensitive to high-volume SKU errors, capturing real-world effects on inventory costs and service levels.
✔ Optimizes Safety Stock Decisions – By prioritizing accuracy for high-demand products, WAPE helps determine more precise inventory buffers.
✔ Reduces the Bullwhip Effect – WAPE’s focus on total demand error (rather than per-SKU percentages) helps to stabilize procurement and replenishment planning.
✔ Ideal for Aggregate Forecasting – WAPE aligns more with demand planning strategies that prioritize total forecast accuracy over individual SKU errors.
Example: MAPE vs. WAPE as a Demand Planning Metric
Consider two products, A and B:
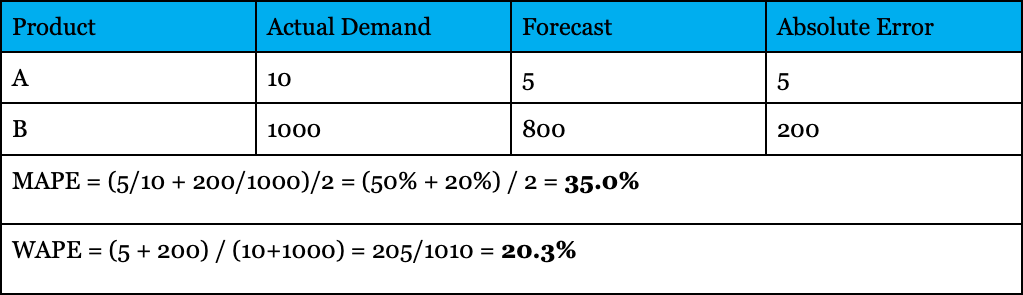
Why This Matters for Demand Planning:
MAPE overstates effective error due to the low-volume item miss, potentially triggering unnecessary location-level inventory adjustments.
WAPE provides a real-world picture by emphasizing the high-volume item’s impact, leading to more effective location-level stock decisions.
Conclusion: WAPE Drives Better Demand Planning & Inventory Efficiency
For businesses that rely on demand planning to optimize inventory, WAPE is the better metric because WAPE:
✔ Prioritizes high-impact forecast errors (weighted by demand volume).
✔ Improves location inventory policies by aligning safety stock with true demand variability.
✔ Reduces excess stock and stockouts by focusing on SKU accuracy where it matters most.
While MAPE is useful for benchmarking individual SKUs, WAPE should be the go-to metric for demand planners who need to tie forecast accuracy to inventory efficiency.
Recommendation for Demand Planners
If your demand planning process relies on forecast accuracy metrics, use WAPE as the accuracy metric to ensure inventory decisions are driven by demand errors that truly affect bottom-line costs.