While foundational metrics measure inventory flow and availability, financial metrics reveal the true cost of inventory investment and help organizations optimize working capital. These financial measurements are essential for CFOs, supply chain leaders, and operations managers who must balance service levels with financial performance.
Inventory Carrying Cost
Inventory carrying cost represents the total expense associated with storing and maintaining inventory over a specific period, typically expressed as a percentage of total inventory value. This metric reveals the true cost of holding inventory and helps optimize stock levels.
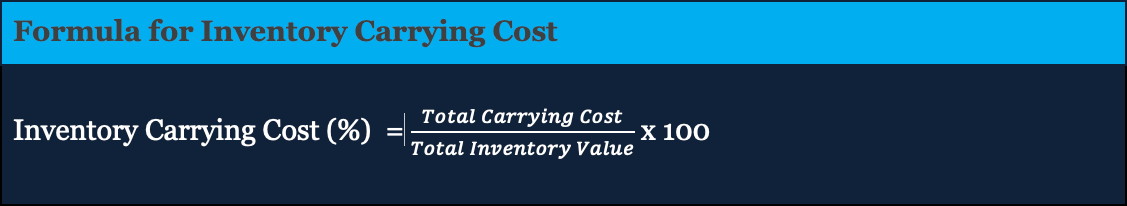
Cost Components:
- Capital Costs (largest component): Interest on invested capital, opportunity cost of capital tied up in inventory
- Storage Costs: Warehouse rent, utilities, climate control, material handling equipment
- Service Costs: Insurance, inventory management software, taxes, administrative expenses
- Risk Costs: Obsolescence, shrinkage, damage, theft, depreciation
Industry Benchmarks:
- Standard range: 15-30% of total inventory value
- E-commerce businesses: 18-30%
- Wholesale operations: 25-40%
Cost Reduction Strategies
Organizations can reduce carrying costs by improving demand forecasting, implementing just-in-time practices, negotiating better payment terms with suppliers, optimizing warehouse layouts, and reducing safety stock through improved forecast accuracy.
Gross Margin Return on Investment (GMROI)
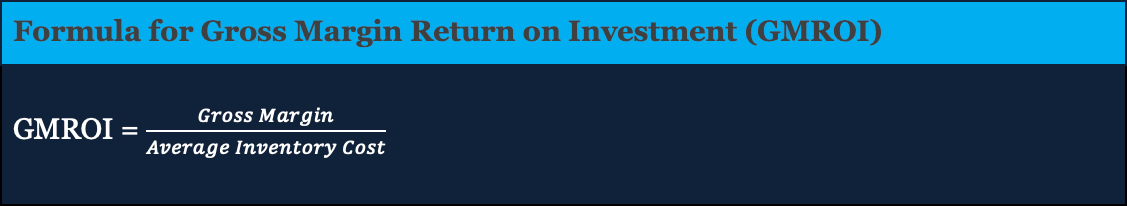
GMROI measures how much gross profit is generated for every dollar invested in inventory. This powerful financial metric evaluates inventory productivity and helps prioritize investment decisions.
Strategic Value
GMROI provides a more complete picture than gross margin alone by accounting for inventory investment. A product with high gross margin but slow turnover may have lower GMROI than a product with modest margins but rapid turnover. Use GMROI to guide product mix decisions, pricing strategies, and promotional planning.
Target Performance
GMROI greater than 1.0 indicates profitable inventory investment, though targets vary by industry. Luxury goods may target higher GMROI due to longer holding periods, while commodity businesses may operate with lower ratios but higher volume.
Inventory-to-Sales Ratio
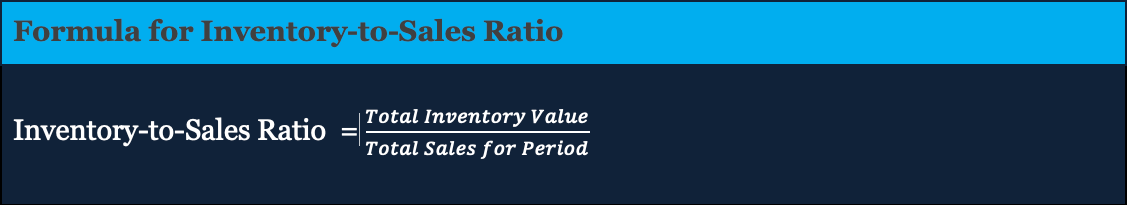
The inventory-to-sales ratio metric tracks the relationship between inventory investment and revenue generation, revealing how efficiently inventory supports sales performance.
Optimization Targets
Lower ratios generally indicate efficient inventory management, though ratios vary by business model. Manufacturers typically maintain higher ratios than retailers. Monitor ratio trends over time and investigate significant deviations from historical patterns.
Stock-to-Sales Ratio
The stock-to-sales ratio compares inventory on hand to sales volume, revealing whether inventory levels align with current demand patterns. This forward-looking metric helps prevent both overstocking and stockouts.

Dynamic Management
Optimized ratios vary by season, product lifecycle stage, and market conditions. Organizations should establish target ratios for different product categories and time periods, then monitor actual performance against these benchmarks. Significant deviations warrant immediate investigation and action.
Financial Metrics Dashboard
Creating value from financial metrics requires:
- Executive Visibility: Monthly reporting to finance and operations leadership
- Product-Level Analysis: Calculate metrics by category, brand, and SKU
- Trend Monitoring: Track changes over quarters and years
- Root Cause Investigation: Dig into drivers of cost increases or GMROI declines
- Cross-Functional Collaboration: Align finance, sales, and operations on improvement initiatives
Next in Series
Operational Efficiency Metrics: Driving Customer Satisfaction will explore operational efficiency metrics that directly impact customer satisfaction and daily supply chain performance.